Personality types have always been an interesting area to explore, starting from simple Type A/B to blood types to more complex ones like Myers-Briggs.
The Myers-Briggs Personality Indicator (MBPI) is based off of the psychological theories of personality suggested by Carl Jung. Creators, Katharine Briggs and her daughter Isabel Myers, constructed a total of 16 different personality types, using four main indicators:
- Extroverted / Introverted
- INtuitive / ObServative
- Thinkers / Feelers
- Judgers / Prospectors
A more detailed explanation of the 16 personality types, as well as a test to find out your type can be found here.
I go to a small, liberal arts college that focuses in STEM (Science, Technology, Engineering and Mathematics) subjects called Harvey Mudd in Claremont, California. Recently, I conducted a school-wide survey asking for their personality types, dormitories and major. By the third day the survey was released, I received 250+ responses (out of about 800 students in total). The results were fascinating.
Here is the breakdown of the entire school.
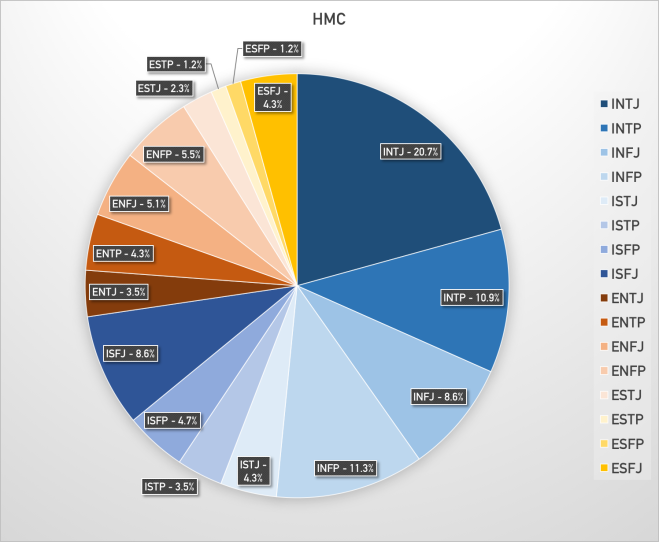
Data as of 1 pm, Nov. 19, 2015.
For ease in viewing, I have color coded introverts in cooler hues and extroverts in warmer ones. The apparent majority is the introvert, comprising approximately 70% of the sample.
To some surprise, the percentage of INTJ-type individuals in the world is about 2-4% of the population (myersbriggs.org). The percentage of INTJ’s in Harvey Mudd is about 21%.
Response bias is definitely not to be overlooked here. INTJ’s are well-known to be highly curious individuals who would be certainly interested in finding out their peers’ personality types. Yet, a near 10 times the frequency is statistically significant.
What’s more intriguing is the breakdown of these types based on dorms. Harvey Mudd has 9 dormitories of mixed gender and year. Each dorm is known for characteristic personalities ranging from quiet and reserved to party-on-Mondays.
Here we have some more pretty pies for each dorm (click to enlarge):


From this we see that Linde, North and West dorms have a greater density of extroverts in stark contrast to East, Sontag and South dorms, where 80% to 90% are introverts.
What does this say? Well, if you’re a Mudder and you’re reading this, you know these dorm personalities definitely exist to some extent. If you’re not, it may be some indicator to show you that these dorms are microcosms of real-world cultures, in which alike personalities tend to cluster.
As for myself, an ENTJ who loves to get to know others and is active in doing so, I took this one step further and broke it down by major.
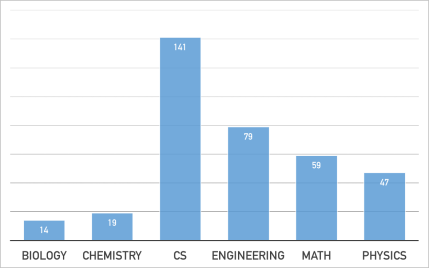
Harvey Mudd has six majors: Biology, Chemistry, Physics, Mathematics, Computer Science and Engineering. Students are able to major in more than one, or take a joint-major. As of November 19th, 372 responses for majors were tallied.


We now know that that math majors are extroverts.
Before looking into these graphs though, it must be noted that the distribution of majors at Mudd is rather unbalanced:
There are various limitations on how deeply we can interpret the data collected. I have kept the survey open for further responses here for any other current Mudders and for alumni.
Though this survey was conducted out of pure fun and giggles, I’d love to see this taken out to the other colleges and compared.
For the time being, I hope this was as fun to look at as I did.

Hey, I really like your post. You did an amazing job getting responses, making the charts pretty, and explaining things. I do wish you had done things slightly differently though; the pie charts don’t really say much, especially in a 9 dorm * 16 types = 144 combination breakdown, even though you have a huge number of responses. I would find it easier to extract information from this if you had done a simple breakdown by I vs E, N vs S, etc. for each category (right now I can only see the I/E data, and that’s after some squinting). Plotting each dorm or major as a data point in 4 space (x, y, size, color) would also be pretty neat. Content for a second post?
LikeLike
Sounds like a great idea 🙂 Thanks for the suggestion!
LikeLike
Hey – thanks for sharing this information! I recall that M-B was part of freshman orientation for me at Mudd (in 2006). It might be worth asking around to see if they’ve got data on M-B types from back then that you could compare to what you found this year.
LikeLike
Hmm.. I’ll have to ask around for that information but it would really be interesting to see how Mudders have changed.
LikeLike
Being an engineering major who lived in East dorm and graduated in 1984, I found it so entertaining to see how little things have changed (though we only had five dorms then). Perhaps get alumni to take this and see what has changed over time?
LikeLike
Wow, it would be awesome if I could get enough alumni to also participate. It’s also interesting to hear that dorm traits haven’t changed much.
LikeLike
Alumni only form here:
http://goo.gl/forms/ygSVc6zGmh
LikeLike
May alumni submit their data or would that bias the results too much?
LikeLike
I don’t think the results would change greatly but I set the surveys so that only @hmc users have permission to submit. Also, I think if it were possible to send a separate survey for alumni, even more unique comparisons could be made..
LikeLike
we have permanent access to our @hmc email addresses. Can we access the survey that way?
LikeLike
I’ve created an alumni only form: http://goo.gl/forms/ygSVc6zGmh
LikeLike
Alumni only form here: http://goo.gl/forms/ygSVc6zGmh
LikeLike
I’m an alum, and I love this! Unfortunately, I can’t access the survey — it says access is restricted. I’d love to fill it out to add to your data set, though, so let us know if you get it unrestricted. : )
LikeLike
It’s restricted to @hmc accounts, maybe you’re not logged in?
LikeLike
Do you have the raw results available anywhere? I’d love to run some X2 tests on them, just for fun.
LikeLike
Sure, email me at contact@littlewhitefang.com and I’ll send you the raw data.
LikeLike